Animated Stock Market Charts Free Video
Free stock video featuring animated stock market charts - dynamic motion graphics that visualize financial data such as rising and falling price curves, candlestick charts, bar graphs, line plots, and market indices movement. The animation typically includes smooth transitions, glowing highlights, and real-time visual energy that conveys market trends, economic momentum, business analytics, and financial performance. This high-resolution footage provides engaging visuals for financial news, business presentations, economic explainers, and any content that requires clear, compelling data visualization in motion.
Suggested Uses
" Finance & Business Content
- Stock market analysis videos: Use as B-roll in videos explaining market trends, index movements, and trading insights.
- Financial news segments: Integrate into broadcast or digital news to illustrate market action and economic shifts.
- Investor education: Support content about investing basics, technical analysis, or portfolio strategy using animated charts.
" Corporate & Marketing Videos
- Quarterly reports & earnings calls: Add motion chart visuals behind narrated financial results or business reviews.
- Brand presentations: Use in investor pitches, corporate strategy presentations, and boardroom decks.
- Company promos: Feature animated data in marketing videos for fintech services, brokerage platforms, or analytics tools.
Film & Video Production
- Documentary B-roll: Use in documentaries about economics, Wall Street, cryptocurrency, or global trade.
- Explainer animations: Combine with voiceover for clear, visually engaging explanation of financial concepts.
- Scene transitions: Use as animated backgrounds or cutaway visuals between interview or presenter segments.
" Social & Short-Form Content
- YouTube & Shorts: Add engaging motion visuals to short videos about market updates, economy summaries, or trending stocks.
- Reels & TikToks: Use animated chart footage to emphasize financial tips, investing highlights, or economic facts.
- LinkedIn & Twitter clips: Share short looping chart animations to support thought leadership in finance and business.
Web & Digital Media
- Website hero loops: Feature on financial news sites, investment services landing pages, or business portals.
- Blog embeds: Enhance articles about market performance, economic data, or investing strategies.
- Interactive dashboards: Integrate into web analytics tools or dashboard demos as ambient motion.
" Education & E-Learning
- Economics courses: Use in lectures or online modules teaching macro/microeconomic principles and market behavior.
- Finance tutorials: Add visuals to primer content on chart types (like candlesticks, trend lines, or moving averages).
- Business school content: Support class videos and case studies on real-world financial data interpretation.
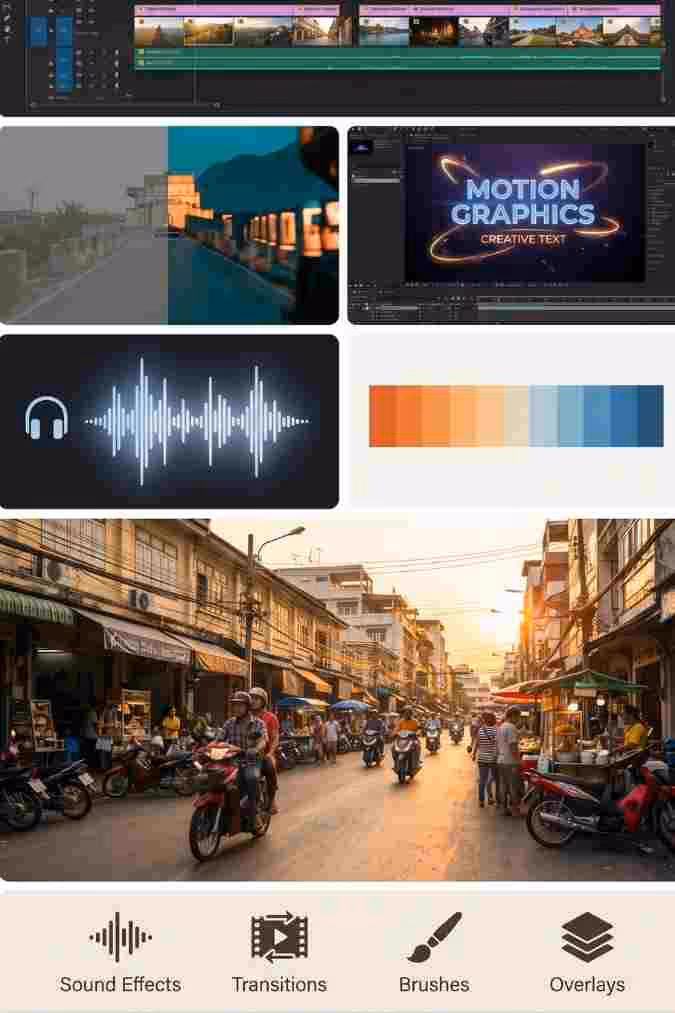
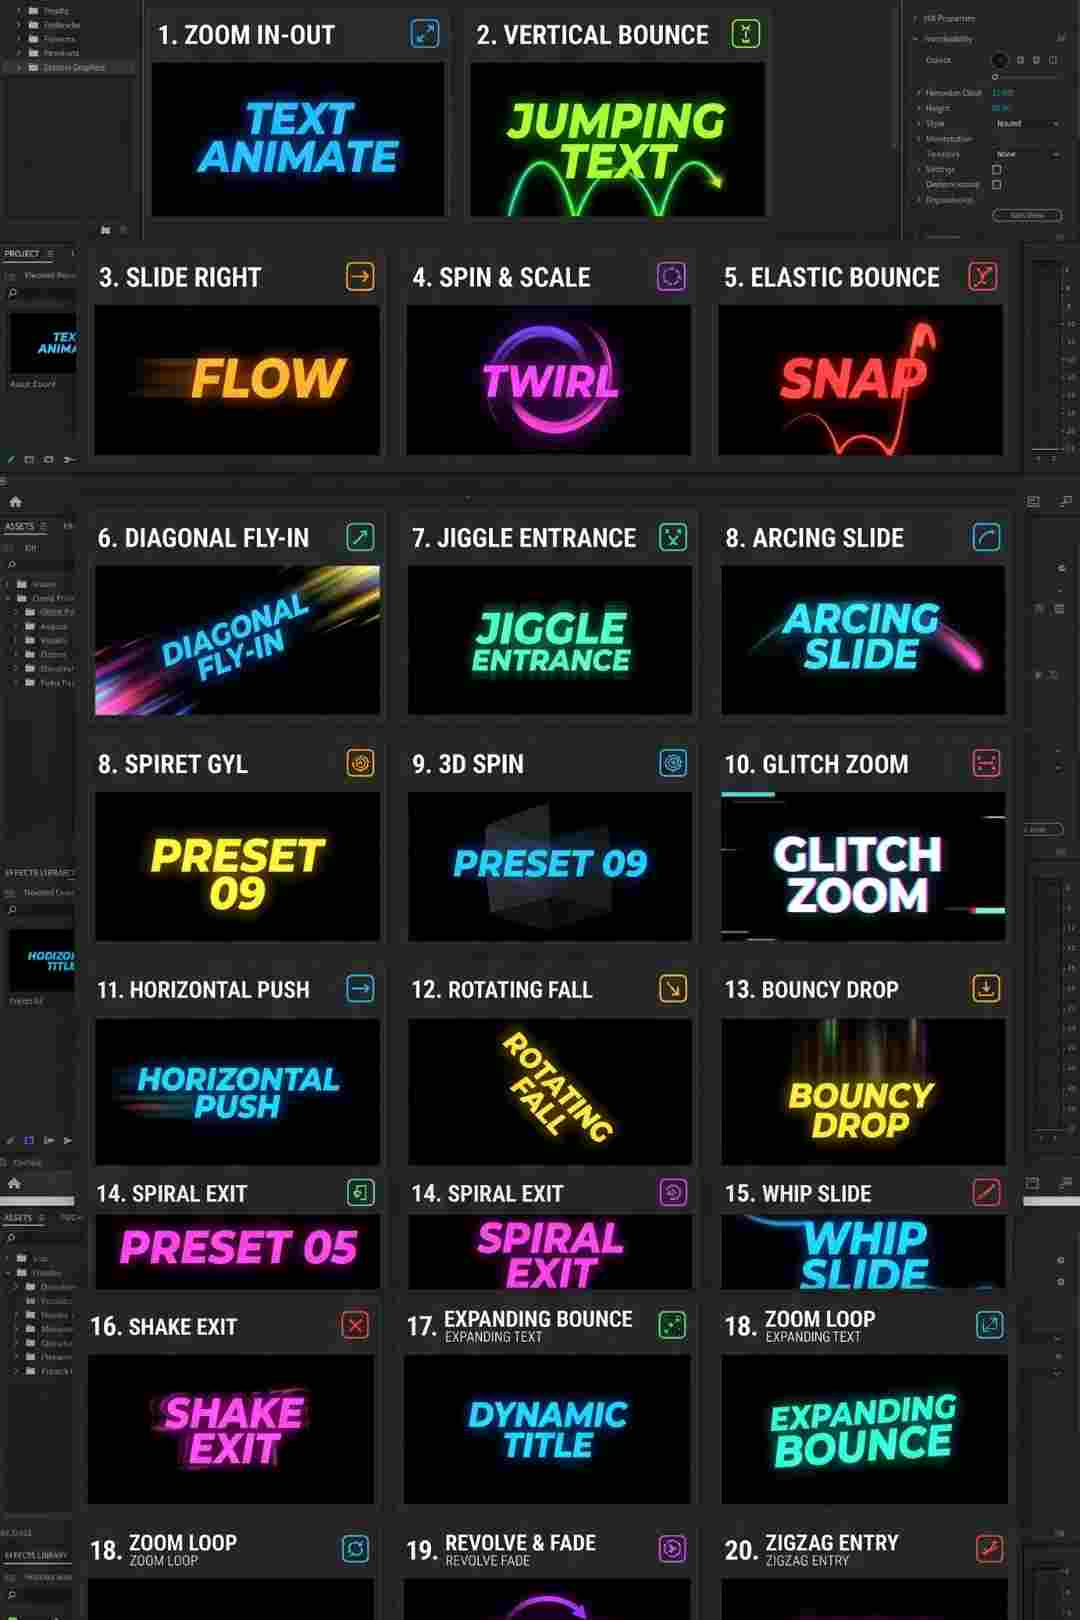
- Motion graphic overlays: Combine with animated text, icons, or data labels for polished motion infographics.
- Portfolio reels: Include in editor or designer reels to showcase animated data visualization skills.
- Ambient backgrounds: Use in broadcast or projection settings where data-centric visuals add context.
.avif)


.avif)
.avif)
.avif)
.avif)
.avif)


