.avif)
Freevisuals
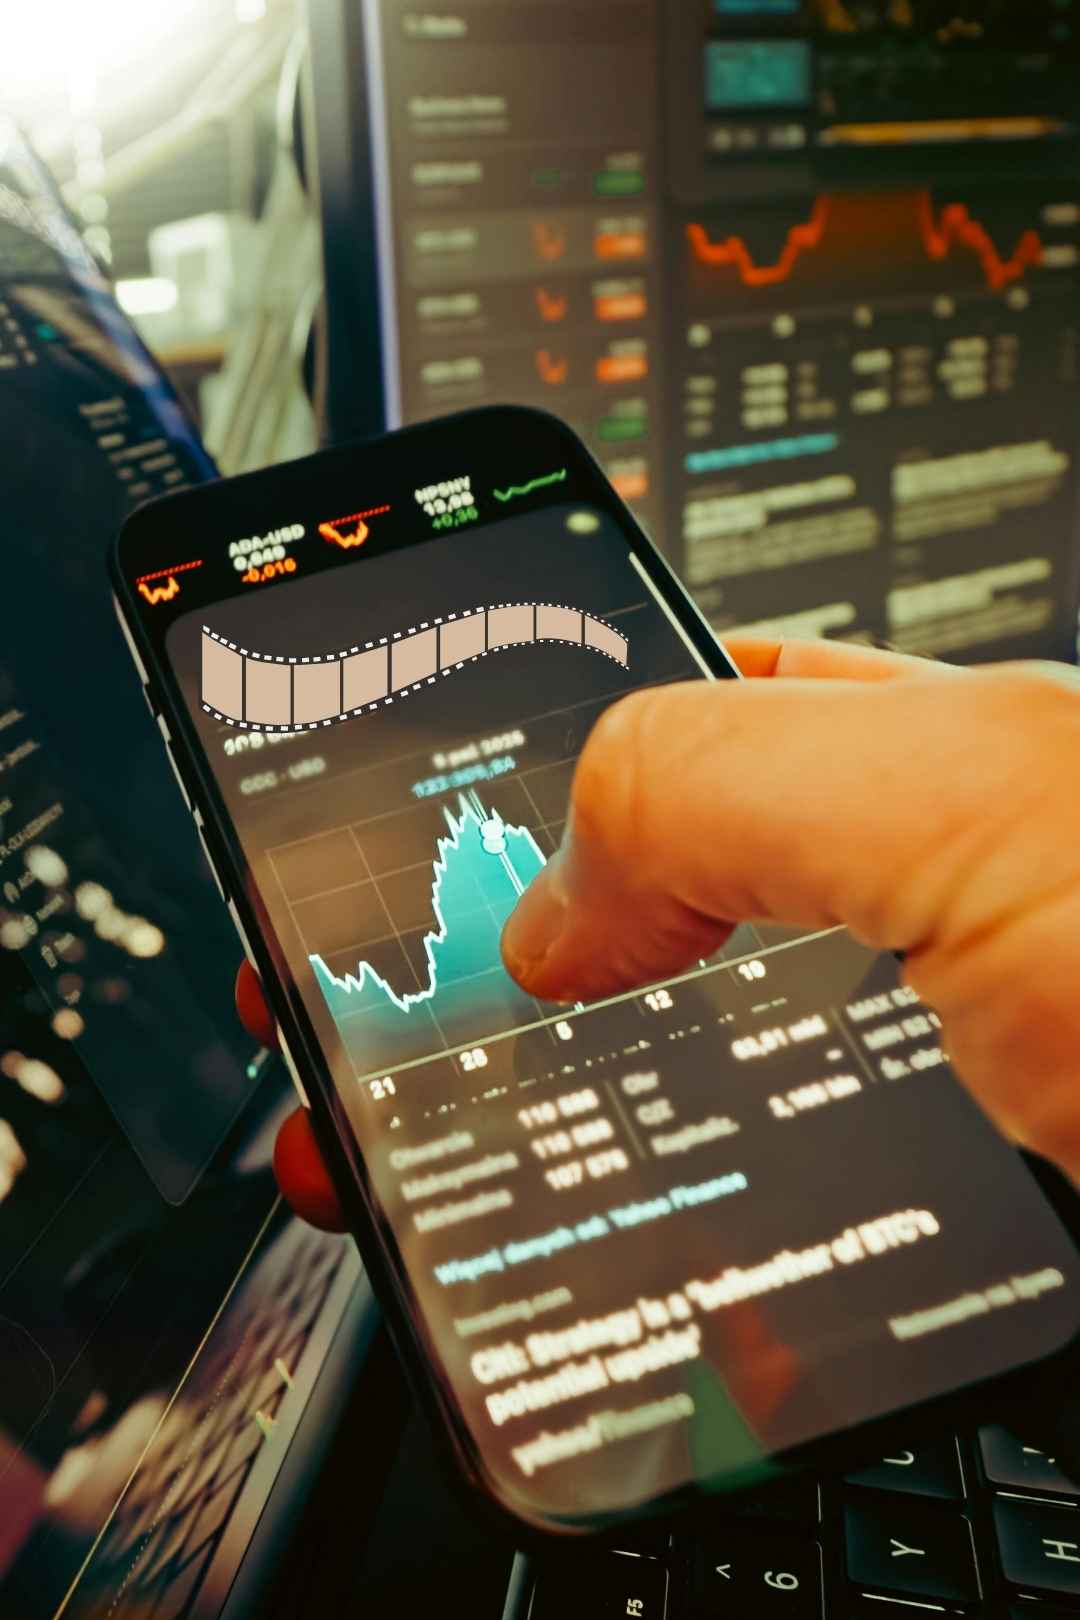
Economy Data Progress Chart is a high-quality, animated stock footage clip featuring a dynamic line graph and economic infographic visuals in HD. It's
Download FREEDownload NOW!Economy Data Progress Chart is a premiumstock videoclip featuring a clean, animated line graph infographic that visually represents data trends, economic progress, or statistical growth. The footage is CGI/animation at 1920 - 1080 HD resolution and includes dynamic motion elements such as upward moving lines, arrows, and numeric indicators, making it ideal for illustrating concepts like financial performance, business metrics, data growth, and trend analysis.
1. Business and Corporate Videos
Use this animated chart clip to visually communicate financial growth, sales trends, performance metrics, or quarterly results in corporate presentations, executive briefings, or investor updates.
2. Educational and Explainer Content
Integrate the clip into educational videos, online courses, or tutorials that explain data analysis, economics, business statistics, or financial literacy. The motion graphic makes complex data easier to understand.
3. Marketing and Promotional Media
Enhance marketing presentations, product demo videos, or service overviews where demonstrating upward trends or success metrics adds credibility and visual interest.
4. Social Media & Short Form Content
Use the animated chart as a visual hook for short-form videos on platforms like YouTube, LinkedIn, Instagram, or TikTok, especially for business tips, economic insights, or data highlights.
5. Broadcast & News Graphics
Ideal for business news segments, economic roundups, or financial reporting where clean, animated data visuals support commentary and storytelling.
Infographic animations like this add visual clarity and professional polish to data-driven narratives.


.avif)
.avif)
.avif)
.avif)